Transforming data into action: How AVEVA™ PI Vision™ drives process efficiency
Mipac helps complex processing operations leverage AVEVA PI Vision to turn raw data into actionable insights, improving decision-making, operational efficiency, and plant performance.
This article examines the AVEVA PI Vision data visualisation tool and its potential for driving decision-making in complex process operations. After exploring its capabilities, we’ll take a look at some of the AVEVA PI Vision projects we’ve delivered for our clients.

What is AVEVA™ PI Vision™?
AVEVA PI Vision is a web-based dashboard and display-building tool that enables quick and intuitive visualisation of real-time operations data. It visualises PI data in both the PI Data Archive and the PI Asset Framework. With no programming required, your team can explore complex datasets, create custom dashboards, and drive improvements with instant, self-service insights.
Key Features
Reusable real-time displays
- See real-time process displays in a browser. Securely access, share, and monitor – anywhere.
- Build custom displays in an intuitive workspace with a large selection of adaptable symbols and graphics.
- Display symbols infused with your process and contextual data. Just search, click, drag, and drop.
Attach multi-state behaviours to symbols and graphics for visual alarms. - Search the homepage to find your display quickly.
Rapid monitoring and investigation of assets and process events
- Search assets and tags and filter on tag attributes.
- Use the asset-based structure to:
- Switch the display’s context from one asset to another.
- Carry asset context across different displays with contextual navigation links.
- Automatically convert a symbol on the display into a symbol collection for all similar assets.
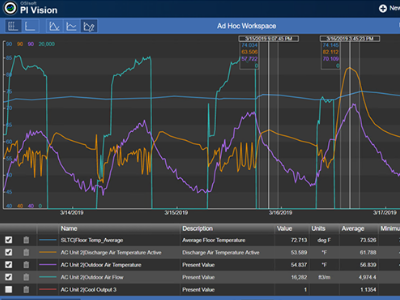
- Select data from multiple displays and see the trends in the ad hoc workspace for impromptu trending and analysis.
- Use expressions on your data or display symbols to create immediate calculations.
- Use event-contextualized search, analysis, and comparison to investigate data associated with essential conditions and periods affecting your operations.
Scalable performance and management
- Display data across your enterprise with native AVEVA™ PI System™ integration.
- Enable Windows-based as well as modern, claims-based authentication.
- Integrate with AVEVA™ Asset Information Management and AVEVA™ System Platform.
Challenges without AVEVA™ PI Vision™
Without AVEVA PI Vision, operational leaders and managers face numerous challenges that impact the efficiency and effectiveness of processing plant management.
- Limited Real-time Visibility
Without real-time operational visibility, operational leaders can struggle to get an accurate and timely overview of the plant’s performance. This lack of immediate access to critical data makes it difficult to quickly identify and address issues, leading to potential delays and inefficiencies. - Manual Data Analysis
In the absence of customisable displays, you must rely on manual data collection and analysis. This process is time-consuming and prone to errors, making it harder to track key performance indicators and make informed decisions. - Reactive Maintenance
Without timely maintenance alerts based on real-time data, you have to rely on scheduled maintenance routines. This reactive approach can lead to unnecessary maintenance activities and unexpected equipment failures, reducing asset reliability. - Limited Decision Support
Without scalable performance and comprehensive data visualisation, you lack the necessary tools to support strategic decision-making. This limitation can hinder the ability to optimise processes and improve operational efficiency.
So, how can AVEVA™ PI Vision™ make a difference in your operation?
- Solve problems faster: Dynamic displays and intuitive navigation streamline problem diagnosis and response.
- Accessible insights: View critical data anytime, anywhere, even on mobile devices.
- Enhanced collaboration: Create and share consistent dashboards that align teams across the organisation.

Operators and engineers rely on PI Vision to keep operations running smoothly and efficiently.
From managing process upsets to addressing equipment failures and unplanned downtime, your role demands quick responses and proactive problem-solving. Access to real-time operational data is critical for troubleshooting issues as they arise and anticipating and preventing them altogether.
With AVEVA PI Vision ’s self-service tools, you can bypass the usual hurdles: no waiting for IT to grant data access, no repeated trips to the control room, and no drawn-out discussions to locate and extract the needed information.
For C-suite executives, managers, and business leaders, operations data is key to answering critical questions
Are we meeting production forecasts? Are we compliant with regulations? How is the entire enterprise or fleet performing? Without real-time access, decision-making often relies on outdated data from yesterday, last month, or even last quarter. AVEVA PI Vision changes that by delivering live information at your fingertips. Whether you need high-level KPIs, aggregated trends, or raw data points, PI Vision ensures you have accurate, reliable insights to make informed, timely decisions confidently.
Leverage our expertise with a collaborative approach
Our Mipac AVEVA PI System experts work closely with your team to understand operational challenges and design solutions that fit your needs. Whether you require bespoke dashboards, customised training, or ongoing support, we’ll partner with you every step of the way to deliver:

1. Real-time operational data isualisation
- Capability: Building intuitive, real-time dashboards tailored to operational needs.
- Expertise: Creating reusable and scalable displays using AVEVA PI Vision’s drag-and-drop interface and symbol library.
- Outcome: Operators and engineers gain instant, secure access to data for on-the-fly monitoring and process analysis.
2. Advanced asset monitoring and nalysis
- Capability: Leveraging PI Vision’s integration with PI Server to display asset data across enterprises.
- Expertise: Developing contextualised displays for trends, alarms, and events using advanced filtering and search functions.
- Outcome: Teams can conduct ad hoc analyses to diagnose issues, compare live data trends, and prioritise responses efficiently.
3. Customised dashboards for diverse user roles
- Capability: Designing role-specific dashboards to meet the needs of operators, managers, and executives.
- Expertise: Integrating multi-state behaviours for visual alarms, event severity indicators, and KPI tracking.
- Outcome: Provides all stakeholders with meaningful insights, from detailed equipment health for engineers to high-level production overviews for business leaders.
4. Scalable deployment and reusability
- Capability: Creating displays that automatically adapt to asset changes using PI Server asset templates.
- Expertise: Designing dynamic dashboards that scale effortlessly to support hundreds of assets or data points.
- Outcome: Reduced time and effort in setting up and maintaining displays for ongoing operations.
5. Enhanced event reporting and troubleshooting
- Capability: Visualising operational events and pre-event conditions to support root cause analysis.
- Expertise: Using PI Vision’s event table and trend overlays to investigate anomalies and correlate trends across multiple variables.
- Outcome: Faster identification of causes for process deviations, enabling corrective actions before they escalate.
6. Integrated process and production reporting
- Capability: Automating production reports with seamless navigation between timeframes (daily, monthly, etc.).
- Expertise: Summarising critical metrics like throughput, recovery, and targets in easy-to-understand formats.
- Outcome: Streamlined shift handovers and improved team alignment with up-to-date performance insights.
7. Collaborative display sharing and notifications
- Capability: Enabling real-time collaboration with shared dashboards and embedded email notifications.
- Expertise: Embedding PI Vision dashboards in notifications triggered by specific events or schedules.
- Outcome: Improved communication between internal teams and external stakeholders, ensuring timely responses to critical conditions.
8. Security and reliability
- Capability: Ensuring secure access to PI Vision through advanced authentication and encryption methods.
- Expertise: Implementing data protection measures aligned with industry standards.
- Outcome: Trusted data visualisations accessible only to authorised users, maintaining confidentiality and integrity.
How Mipac delivers results
Mipac’s AVEVA PI Vision specialists are experienced in translating complex operational challenges into actionable visual solutions. By combining technical expertise with a deep understanding of your processes, we deliver dashboards that enhance visibility, improve decision-making, and drive operational performance.
Here’s how we’ve partnered with clients to solve real-world challenges:
System health monitoring


Mipac created dashboards that provide a holistic view of system health, aggregating data from PI System performance, server health, and network equipment.
- Challenge: Diagnosing system health was time-consuming and required accessing multiple systems.
- Solution: A centralised dashboard enables operators to pinpoint and resolve issues quickly, ensuring optimal performance.
- Impact: Reduced downtime and proactive issue management across critical systems.
Process overview displays


We developed SCADA-style process overview screens to provide broader access to process data without compromising control system security.
- Challenge: Limited user access to control systems made it hard to share operational insights.
- Solution: Read-only dashboards offer simplified views of critical process flows tailored to non-operator users.
- Impact: Improved accessibility and collaboration across operational teams.
Production and plant performance reporting


Dashboards summarise key metrics such as throughput, recovery, energy consumption and production targets, with seamless time-based navigation.
- Challenge: Delays in accessing live performance data hindered timely decision-making.
- Solution: Real-time dashboards and KPIs inform teams of progress toward goals and allow trend analysis.
- Impact: Enhanced production monitoring and goal alignment.
Event reporting for critical insights

We created and visualised load-shedding events (using PI event frames) to help teams analyse pre-event trends and respond to operational disruptions.
- Challenge: Lack of visibility into events’ root causes created inefficiencies.
- Solution: Interactive displays offer context-rich insights into historical and real-time events.
- Impact: Faster recovery and improved planning for future events.
Get started on your AVEVA™ PI Vision™ journey with Mipac
Ready to see how AVEVA PI Vision can transform your operation?
Do you currently have an AVEVA PI Vision licence and are not getting the most from it? Contact us, and we’ll set you up with one of our AVEVA PI specialists.
or explore our other AVEVA PI System capabilities here
Check out our latest Insight Articles on Data Analytics and Visualisation
How predictive analytics in mining is a game-changer
Predictive analytics is transforming how mines operate. By turning raw data into actionable insights, it…
Ok Tedi’s AVEVA PI System Journey with Mipac
Ok Tedi, PNG’s longest-running open-pit mine, faced challenges including declining ore grades, operational instability, and…
Modernising control systems: keeping Excel while embracing automation
Excel: a lifeline or a liability? If you’ve spent any time in mineral processing, you’ve…


